Board Member Priorities and Useful Data Tools
Board members approach their work through a host of competing priorities. Focusing on a few key data tools could help them get on the same page.
In case you missed it, last week, WBEZ posted short bios of board members, each stating their top priority for the board in 2025. Four appointed members didn’t respond to WBEZ’s questionnaire: Ed Bannon (1), Norma Rios-Sierra (3), Emma Lozano (7), and Olga Bautista (10). If any of these members would like to share their top priority for this first year of their board service, they can email me at reenie67@gmail.com.
As you might expect with 16 members responding, there were a whole lot of different priorities mentioned. Four members prioritized student academic achievement, especially sustaining the district’s impressive academic rebound after the pandemic school closures. Three members, all with strong CTU ties, mentioned sustainable community schools as their top priority. Another three members put finances first, either by highlighting the need for a comprehensive financial plan for the district or pushing for every school to enjoy adequate, equitable resources. Two members called for restoring public and parent trust in the system.
The members’ unique priorities were often more telling. Only Sean Harden referred to state politics, citing “strong collaboration with Springfield leadership” as his top priority for the year. Michilla Blaise (5) made a striking pitch to focus on student health and wellness, especially for young people dealing with violence. “People are walking around numb and damaged and unable to cope with the violence they see every day and the schools cannot continue to act like they cannot see it.” Yesenia Lopez (7) stated her commitment to expanding dual-language programs. Therese Boyle (9) focused on the issue of staff retention: teachers, principals, clinicians, and paraprofessionals. And, to no one’s surprise, the board’s Grammy winner, Che “Rhymefest” Smith, put teachers, musical instruments, and supplies for music and arts education at the top of his to-do list.
It remains to be seen whether all these competing priorities will align or clash as the board assumes new duties, including conducting a search for a new CEO.
New School Profiles, Under Construction
The board will need to look at data to understand how students and schools are performing, but the district is radically changing its approach to data presentation and use. Chicago Public Schools has stopped using data to rank schools and is developing a system that uses data to hold itself accountable for supporting schools where more students are struggling.
Under Mayor Lori Lightfoot, the Board of Education launched the current project to redesign accountability in CPS. Based on input from thousands of parents and other stakeholders, the new approach upends long-standing views of how to hold schools accountable for performance. Rather than give schools a summative rating, the district’s new school profiles will provide a wealth of information about student performance, school instruction and culture, and the district investments being made to support each school.
Yet the new approach also comes with a downside; the new profiles are much more complex than an online one-pager. They are also a work in progress. CPS expects to finish creating its new metrics to measure students’ everyday experiences and other previously unmeasured aspects of the school experience by the end of 2025.
In the meantime, board members and others interested in understanding how schools are doing can go directly to two key data sources: Illinois School Report Cards for test scores and basic school information, and the 5Essentials surveys for a snapshot of the state of learning conditions in each school.
Milestones on the Road to a College Degree
While the district is revamping how it looks at student success and school quality, the University of Chicago’s To & Through Project tracks the movement of CPS students from sixth grade through college enrollment and from ninth grade through college completion, which includes both 2- and 4-year degrees. The project’s data tools organize CPS data by school and allow users to compare school data on the numbers of students attaining milestones like high school graduation, college entrance, persistence, and completion.
Board members can examine ninth-grade enrollment through college completion in each of their districts. It can be tricky to follow how a graduating class fared over time, but there are very clear graphs to show the percentage of students meeting each milestone over the 15 years from 2008 to 2023. Board members can also see the top five high schools where ninth-graders enrolled for the 2022-23 school year, and see the types of high schools students in their districts are choosing over time.
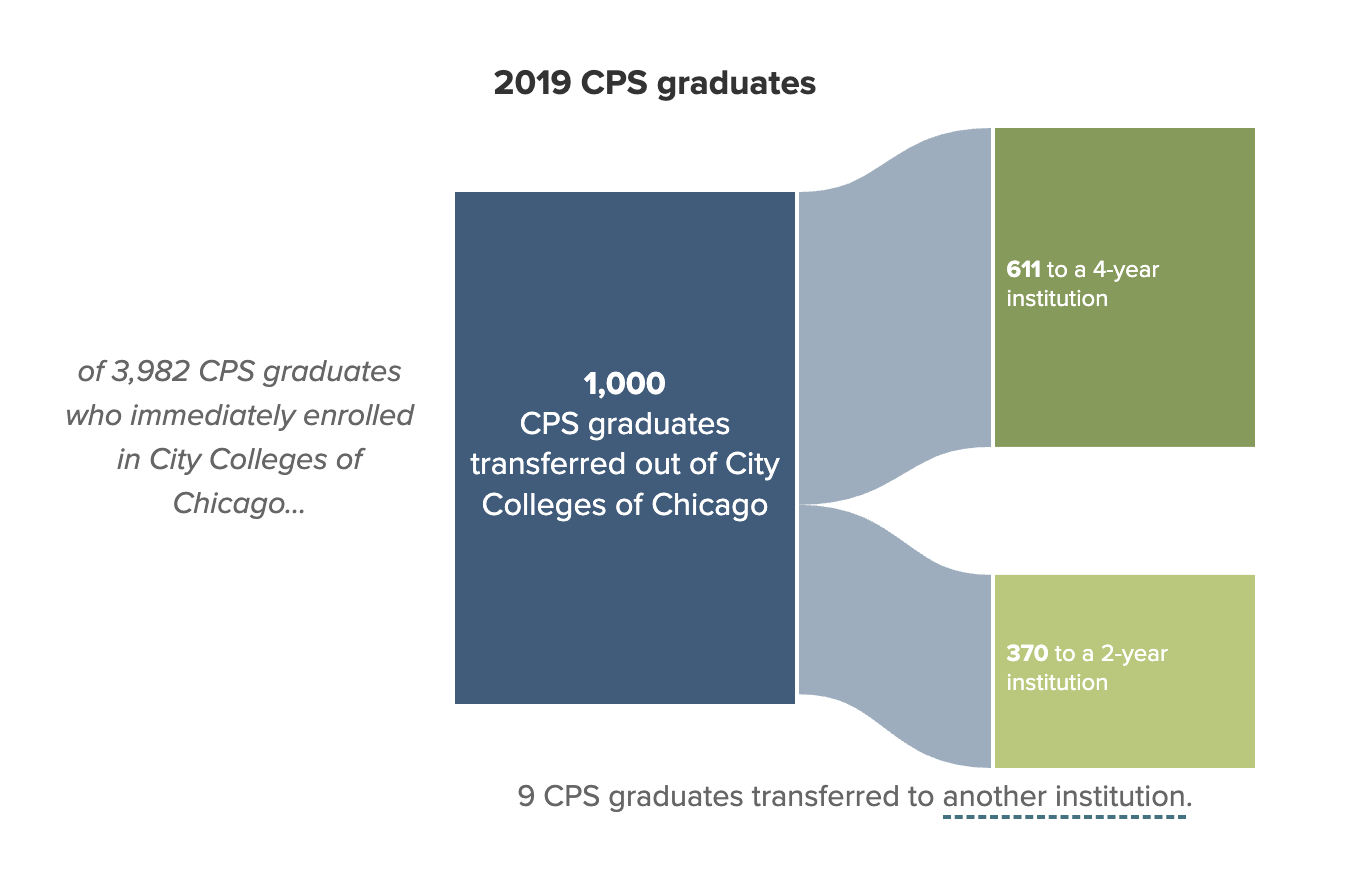
Recently, To & Through launched a new data tool showing how CPS students are progressing through the City Colleges of Chicago, including information on transfers in and out of City Colleges. This new tool sheds light on the actual pathways CPS graduates take through postsecondary education, which often don’t look like a neat conveyor belt from high school graduation into college and through with a degree in two or four years. To understand those journeys from the ground up, To & Through has collected student stories that illustrate the complexities of life after high school for CPS graduates. The financial, bureaucratic, and caregiving challenges they face often force them to blaze new trails, far from the standard pathways to college completion.
Board members, Local School Council members, and anyone interested in understanding what's working and needs work in CPS can use tools like the 5Essentials and To & Through to dig in on the culture of individual CPS schools and consider how it might affect the progress students make toward milestones like high school graduation and college completion.
Comments ()